From sowing to harvest, with cost per hectare
Operation, pest management and harvest connected to the ERP. Each input and machine-hour becomes cost by plot, activity and crop — in real time.
Cost at the source
Inputs, daily wages and machine-hours enter the right cost center at the moment of entry, with no spreadsheet later.
Agronomic decisions with data
Pest, weather and productivity monitoring in one place to anticipate spraying and replanting.
The plot as the unit
Everything is measured by plot and crop — from operation to harvest — to compare seasons precisely.
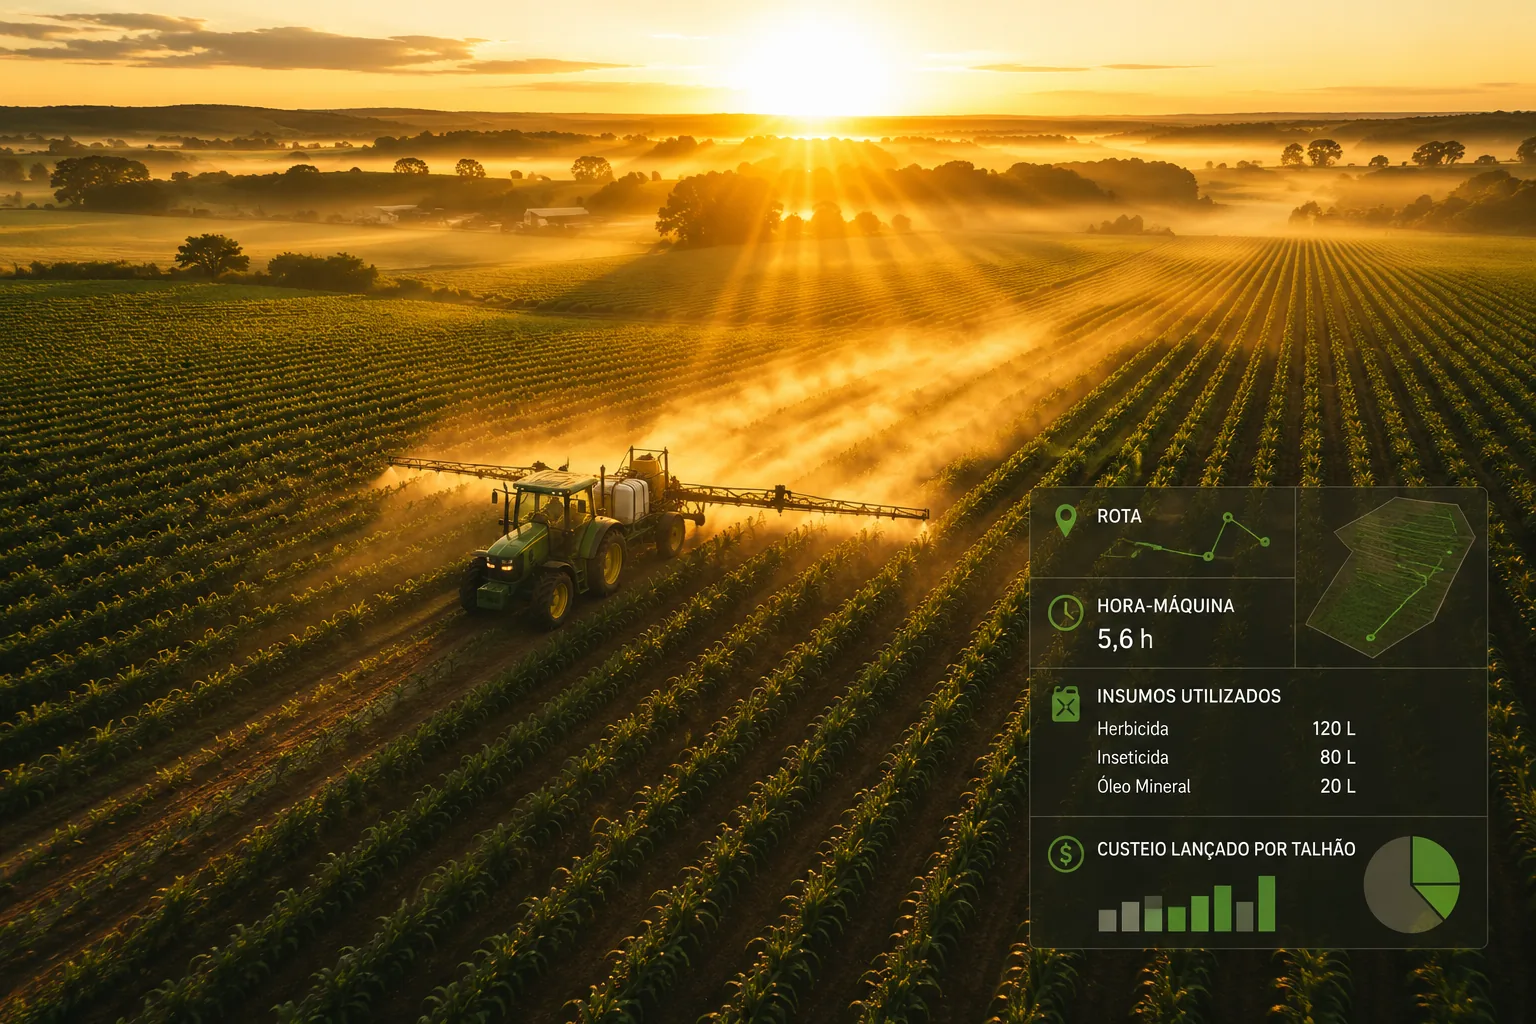
Mechanized operation
Route, machine-hours and inputs recorded in the operation and posted straight to each plot's costing.
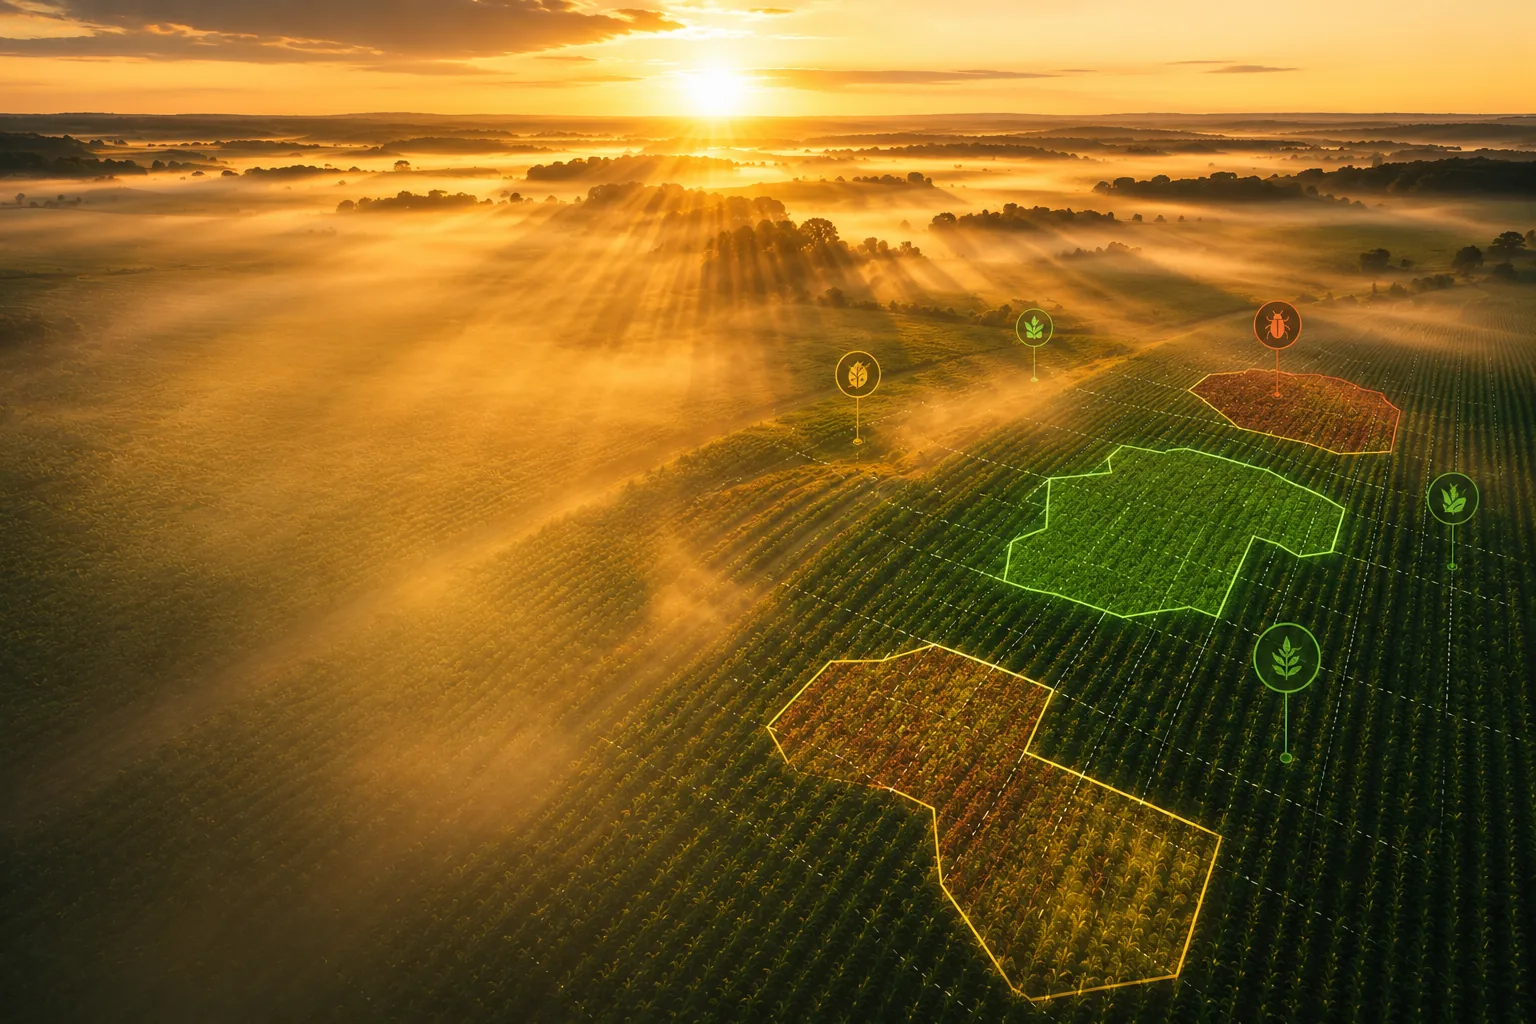
Pest management
Monitoring of insects, diseases and weeds that feeds the spraying status by target on the map.
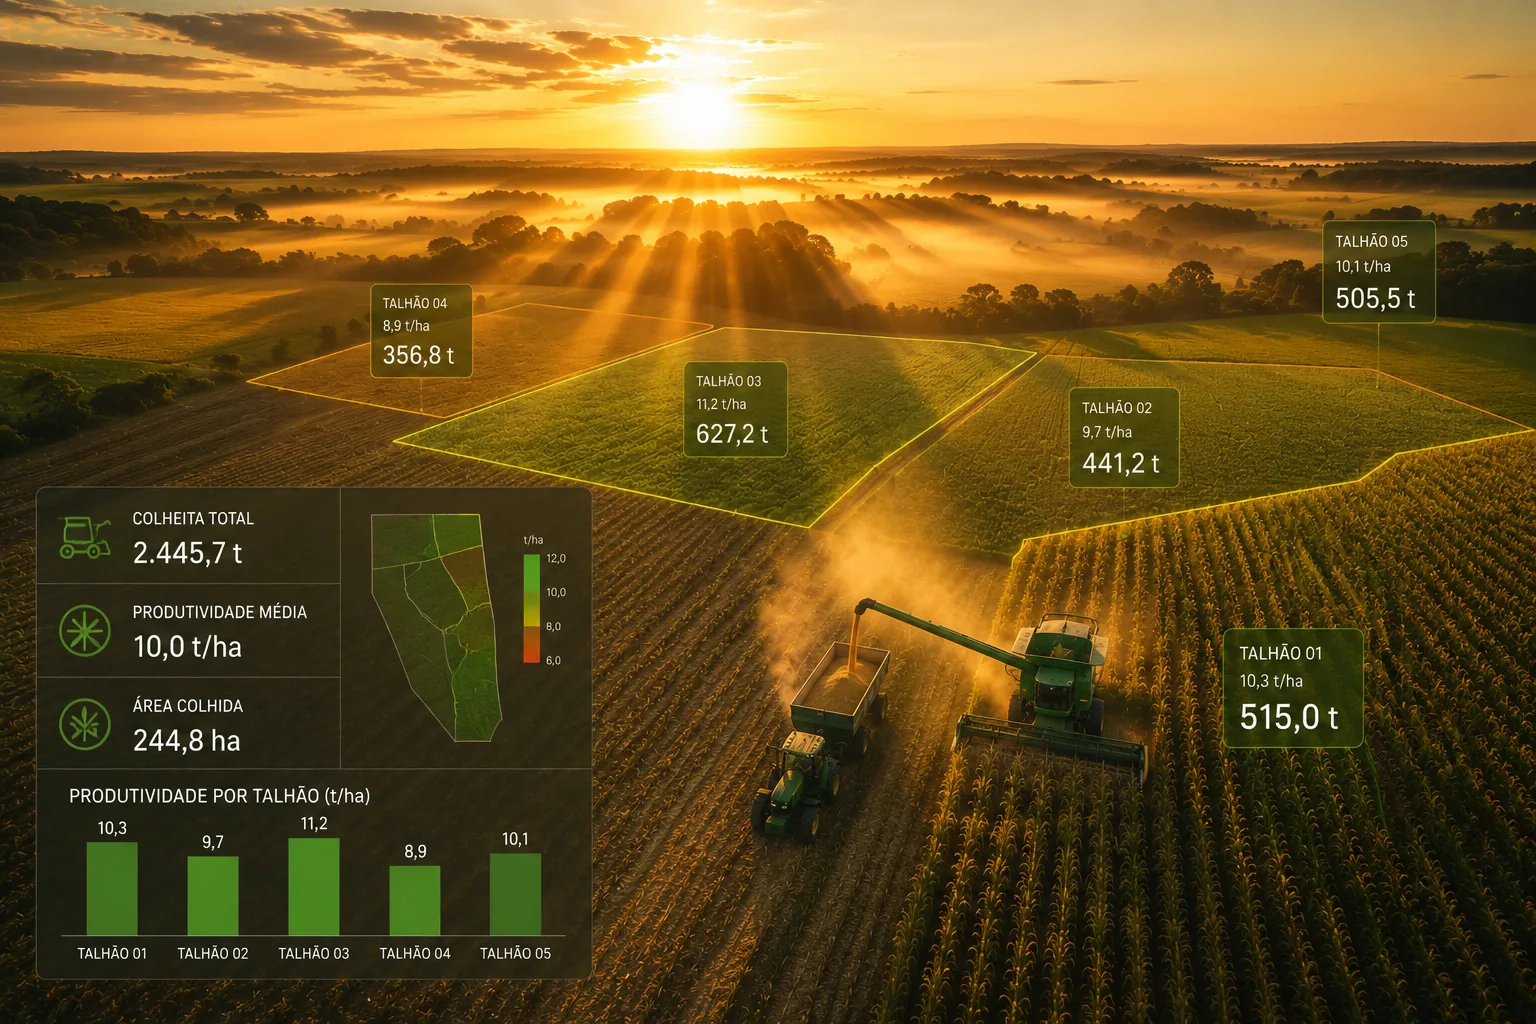
Measured harvest
Harvested quantity with location and productivity by plot, closing the season's result.
71 sc/ha
+11%Real-time costing by plot
Each mechanized operation, input and daily wage enters the right activity's cost. The cost per hectare is calculated as the field records.
- Cost by activity, plot and crop
- Machine-hours and inputs posted at the source
- Productivity comparison across seasons
Anticipate the problem before it spreads
Pest and weather monitoring crossed over the map. Risk appears by target and by plot, with time to react.
- Pest database: insects, diseases and weeds
- Spraying status by target and date
- Climate risk calculated for the operation
From field to indicator, no retyping
What the operation and team record in the plot goes up to the ERP and becomes map, report and dashboard on the Web Platform.
- Offline records that sync on their own
- Same base in the ERP and the Web portal
- Productivity and cost dashboards by season
- Does it work for any crop?
- Yes. Costing is by activity, plot and crop, so it works for grains, perennials and produce — just define the plots and operations.
- How does the pest part come in?
- Through integrated monitoring, with a pest database that feeds the spraying status on the Web Platform map.
- Can I compare seasons?
- Yes. Since everything is measured by plot and crop, the dashboards compare productivity and cost across seasons and periods.
- Does it work without internet in the field?
- Yes. Records are made offline and sync with the ERP as soon as the connection is back.